# setwd("C:\\Users\\devmbeya\\Downloads\\gis-remote-sensing-r") #set working directoryMaking the first map in R
Overview
In this tutorial, you will create a map that shows the range of African Elephant. You will use R’s sf and tmap packages to complete the task. 
Set the working directory
The setwd() function is used to set a working directory The command below sets the rgis folder located in folder in Documents as a working directory.
To check the working directory we use the `getwd() function. It will give you file path to the current directory.
# getwd() Load packages
library(sf) # package for working with vector data
library(tmap) # thematic mapping package
Read data
To read vector data (shapefiles) use the st_read() functiom of the sf package.
africa <- st_read("../assets/data/africa.shp")Reading layer `africa' from data source
`C:\Users\devmbeya\Documents\rforgisrstutorials\assets\data\africa.shp'
using driver `ESRI Shapefile'
Simple feature collection with 54 features and 10 fields
Geometry type: MULTIPOLYGON
Dimension: XY
Bounding box: xmin: -2823124 ymin: -4139718 xmax: 7068315 ymax: 4486662
Projected CRS: WGS 84 / Pseudo-Mercatorrange <- st_read("../assets/data/africa_elephant.shp")Reading layer `africa_elephant' from data source
`C:\Users\devmbeya\Documents\rforgisrstutorials\assets\data\africa_elephant.shp'
using driver `ESRI Shapefile'
Simple feature collection with 4 features and 8 fields
Geometry type: MULTIPOLYGON
Dimension: XY
Bounding box: xmin: -14.89546 ymin: -34.08534 xmax: 44.19669 ymax: 16.63432
Geodetic CRS: WGS 84Explore data
# head(africa)
# head(range)
Create the map
We will use the tmap map-making package to create maps. While it is possible to create maps using the plot() base R function, tmap provides advanced options. tmap’s tm_shape() function is the basic building block. tm_shape() defines input data: vector or raster. tm_shape() is followed by one or more layer elements such as tm_fill(), tm_borders(), tm_polygons(), tm_dots(). We loaded two data sets Africa which shows country boundaries and range which shows the range of African Elephant.
We will symbolise the country boundaries fill with #C3C5B9 color and the Elephant range layer with #F2D685.
Add fill layer to Africa shape
tm_shape(africa) +
  tm_fill() +
  tm_borders(col = "white") +
tm_shape(range) +
  tm_fill(fill="#F2D685") +
tm_shape(africa) +
  tm_borders(col = "green")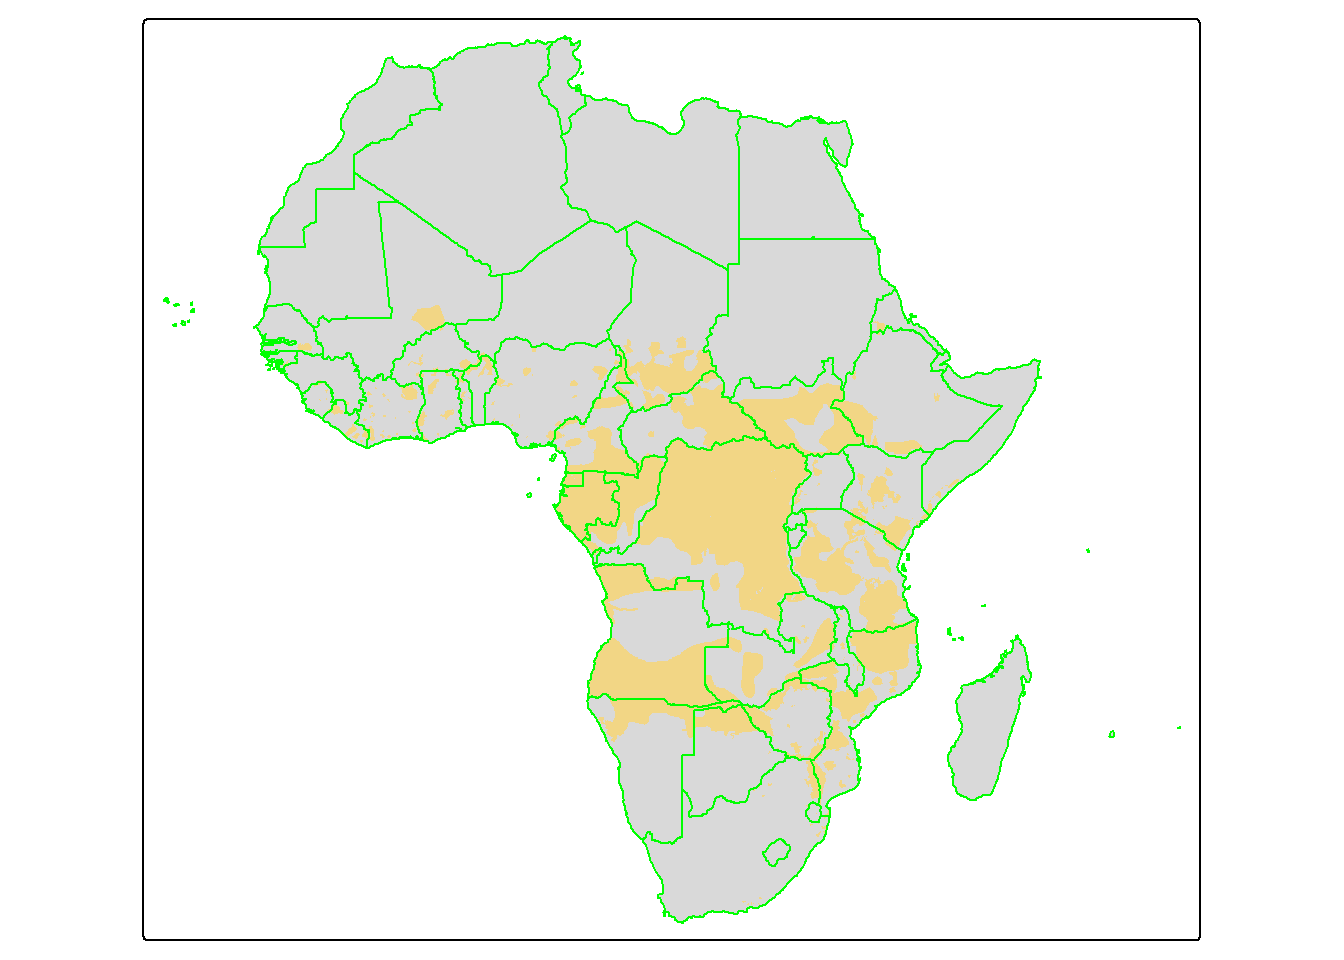
To create a professional map which we can save locally, we will create add more tmap functions. We will add more elements to the map:
tm_title()adds a titletm_text()adds texttm_credits()adds map credittm_logo()adds an imagetm_layoutcontrols the map layout.
Visit tmap package website for more information.
africa_elephant_range <- tm_shape(africa) +
  tm_fill(fill ="#C3C5B9") +
  tm_borders(col="white") +
  tm_shape(range) +
  tm_fill("#F2D685") +
  tm_shape(africa) +
  tm_borders(col = "white") +
  tm_text("NAME", size = 0.6, xmod = 1.4, ymod = 0.8,  alpha=0.5, col = "black") +
  tm_title("Known and Possible\nRange of African\nElephant", color = "#000000",
           position =c(0.05, 0.4), fontface = "bold", size = 1) +
  tm_title("Botswana has the\nhighest African Eephant\npopulation of 130,000", position =c(0.2, 0.3), size = 0.7)+
  tm_credits("Data Source: ArcGIS Hub and World Population Review\nCartographer: Dickson Mbeya\nDate: 21 December 2025",
             position = c("left", "bottom"),
             size = 0.6, color ="#000000") +
  tm_credits("#R4GISRSTUTORIALS",
             fontface = "italic",
             position = c("right", "bottom"),
             size = 0.6, color ="#000000") +
  tm_logo("../assets/images/r.png", position = c("right", "top"),height=1) +
  tm_logo("../assets/data/elephant.png", position = c("left", "top"),height=5) +
  tm_layout(outer.margins = c(0,0,0,0), asp = 1)
Plot the map
africa_elephant_range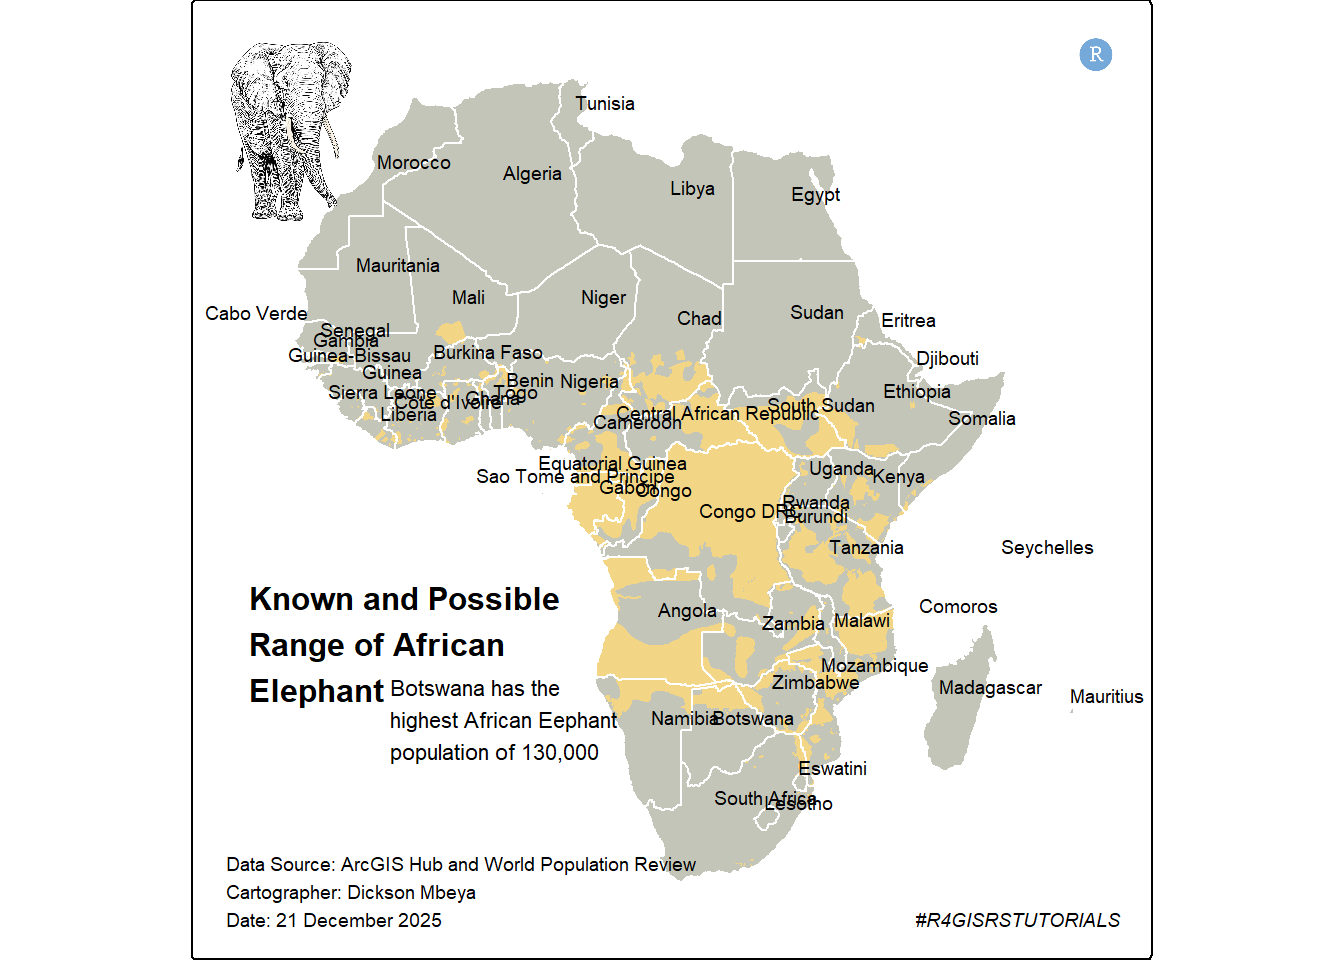
To save a map using tmap, you use the tmap_save() function.
# tmap_save(africa_elephant_range, "African Elephant range.png")